MAWIviz
This website aims at helping
researchers to analyze MAWI traffic traces. It provides several
views, such as scatter plot and time series, of each traffic trace.
These views allow one to understand quickly the characteristics of
MAWI files, and pick up interesting traffic traces to study.
Get started:
Samplepoint-B and Samplepoint-F
2001
- 2002
- 2003
- 2004
- 2005
- 2006
- 2007
- 2008
- 2009
- 2010
Examples:
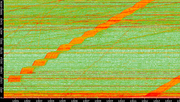
- 2007/07/15:
A large network scan identifiable in two views:
Destination IP vs. time
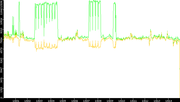
Port entropy vs. time
- Emergence of the sasser worm and its evolution during several months: 2004/07,
2004/08, 2004/09, ...
- Weird things:
More details about the figures:
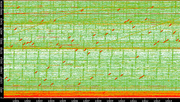
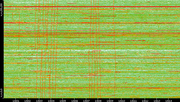
For each traffic trace eight views
are available, four scatter plots and four time series. All of
them are temporal-based pictures with a different traffic feature on
the y-axis.
All these figures have been computed with mulot.
The figures displayed in the monthly and daily view are obtained with the following parametres:
mulot -b 16 -B 16 -X 720 -Y 400 -t 900
Whereas the detailed views are obtained from the following command:
mulot -b 16 -B 16 -X 1800 -Y 1024 -t 900
Meaning that figures represents 900 seconds (15 minutes) of traffic, also, a CIDR of 16 is used to
display source and destination IP addresses. In the former case, the resolution of figures is 720*400
pixels, and 1800*1024 in latter one.